HD Analysis for the Maine Coon (Part 2)
At the same time, Debbie was doing her collection of data for her article, I was in the middle of collecting data for another one.
I wanted to have a look at how HD will affect the offsprings if there is HD present in the closest 5 generations. We know that the health program works and that HD diminishes when we continue to test generation after generation. But most research I have seen been focusing on cats and in some articles their parents but I have never seen a study made on 5 generations.
I will not speculate on where we are going, the only thing I've done in this article is to collect the data and put it in charts so that we can easily see what it looks like today and maybe get another hint on where to go next.
I took all cats that were tested inside the health program, then I started to look them up in PawPeds I counted the number of tested cats for each generation behind...
For example 2, 2, 2, 4, 6 (one column in an excel for each generation), I set up a calculation that calculated the total amount of cats in 5 generations (62) and made a count of how many percentages of those 5 generations where tested.
If there were any cats in the first 5 generations that had HD, I also noted in which generation and how many.
I was quite surprised to realize that the absolute highest amount of tested cats in any cat in the health program where only 79%, I actually had expected to find at least one cat with 100% tested cats in 5 generations, but that was not the case. Now, I do know there might be more tested cats for example with OFA, in fact, I did know for sure in some cases.
But in most cases that's nothing I'm able to see or know, I can't just guess around, so I will go with the statistics we get out from the health program from the start and all the way to June 2020. In all charts, I have gone by the worst hip. A cat with 1-N, 1-B, and so on became 1, a cat with N-2, 1-2, and so on became 2, and so on.
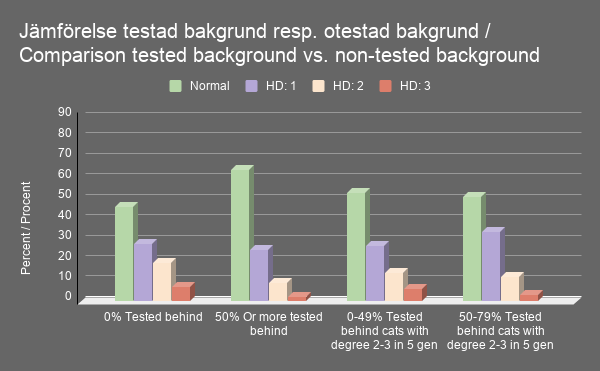
At first, I did a comparison against how many cats there were tested behind each cat, In this graph, I did take into consideration what generations or anything like that.
In the first group, you can see the cats in the percentage who were 1st generation tested cats themselves, there was not a single HD-test behind those cats.
In the second group, you will see the cats who got 50% up to 79% tested cats in five generations, as you can see there is quite a difference between those two groups.
Cats with normal hips are about 20% higher in the group with 50% or more tested cats behind, compared to the cats with 0% tested background.
If we look at the other two groups, here I selected all cats that had 0% up to 49% tested cats behind, but who had ancestors in those 5 generations with an HD-degree of 2 and/or 3.
If we compare to the last group who is cats with 50% up to 79% tested cats behind, but who also got HD-degree 2 and/or 3 behind in those 5 generations.
Here we can see that the difference is not that big anymore those with Normal hips are almost the same, normal are a bit lower on the cats with 50-79% tested behind,
also HD grade 1 is a bit higher, but both HD grade 2 and 3 are lower than in those cats with 0-49% tested cats behind.
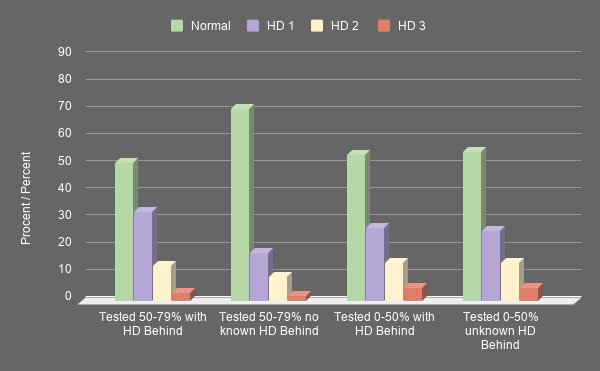
In the next graph, I made a deeper study on the cats that had HD behind them against those who did not have any known cats with HD behind them.
I did not take into consideration if there was one or more, only if there were HD 2 or 3 behind in any generation.
I think the chart speaks for itself but a small description anyway.
The first group is cats with 50-79% tested behind who got ancestors in the first 5 generations with HD grade 2 or 3, the second group is cats with 50-79% tested behind and no known HD.
The third group is the cats with 0-49% tested behind who got ancestors in the first 5 generations with HD grade 2 or 3, and the fourth group is cats with 0-49% tested behind and no known HD.
Then I went a bit deeper once again.
In this chart, I looked at all cats regardless of the number of tested cats behind them and looked for the cats behind them with HD grade 2 or 3.
I separated them regarding, in what generation the first cats with know HD grade 2 or 3 appeared,
It seems like the closer it is the worse HD, for some reason the HD grade 3 is less in the cats who had ancestors with HD degree 2 or 3 for the first time in 2nd generation.
That might be just a coincidence, maybe the grandparents were first-generation tested. I might have to dig a bit deeper into this if possible.
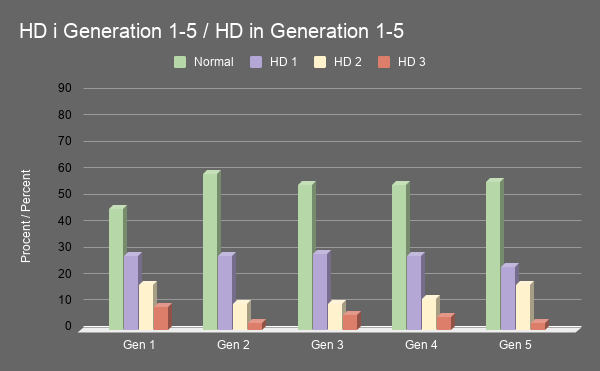 |
| In this graph we see cats who got HD-affected cats behind, and in what generation they appear. |
Once again, I dug even deeper into this so I actually counted the number of affected ancestors behind the cats who got any affected cat behind.
As I said above no cat had affected ancestors in more than 4 generations, and no cat had more than in total 4 affected ancestors behind them.
In some cases, two of the grandparents were affected and 1 far back in the fifth generation, in other cases all affected cats were found in the fifth generation.
This is what I found out, as we can see there is some variation, this migh have to do with how close the HD is or other factors?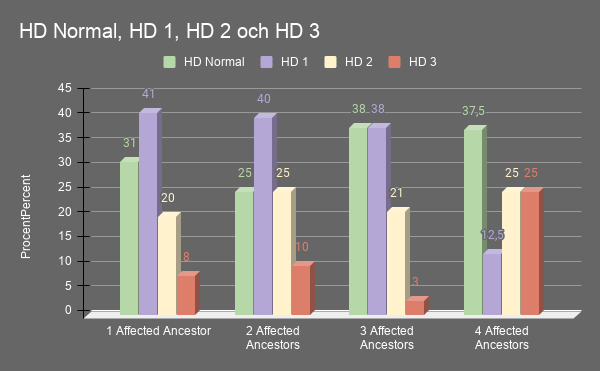
I also had a look at the bigger picture.
I looked at all categories, the compared those who had 1 affected cat behind and 0-49% tested behind, to those with 1 affected cat behind and 50-76% tested cats in 5 generations behind.
And then I repeated for those who had 2 affected, 3 affected and 4 affected, as I said above no one had more than in total 4 affected cats behind them in 5 generations.
How many in each category had normal, grade 1, 2, or 3 compared to all other cats tested. The result in the chart below is in percent and calculated from all 696 cats in the health program who did have affected ancestors to some degree behind them in 5 generations.
I really had a hard time putting this together, there are so much data and variations.
In this graph, all cats with affected cats behind are compared, but they are also in groups of the number of tested cats behind.
Since the number of cats with only 0-49% still is the biggest group in the health program this shows when we do graphs to compare all cats. In the group of cats with Normal Hip status, who got 0-49% of tested ancestors we can see that 38 percent got 1 affected ancestor, 6.3 percent got 2 affected ancestors, 2,9 percent had 3 affected ancestors and only 1 percent got 4 affected ancestors. 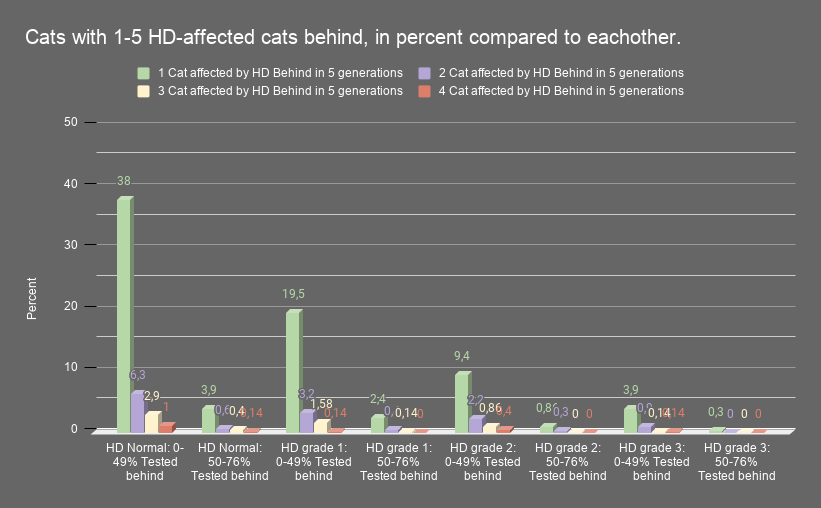
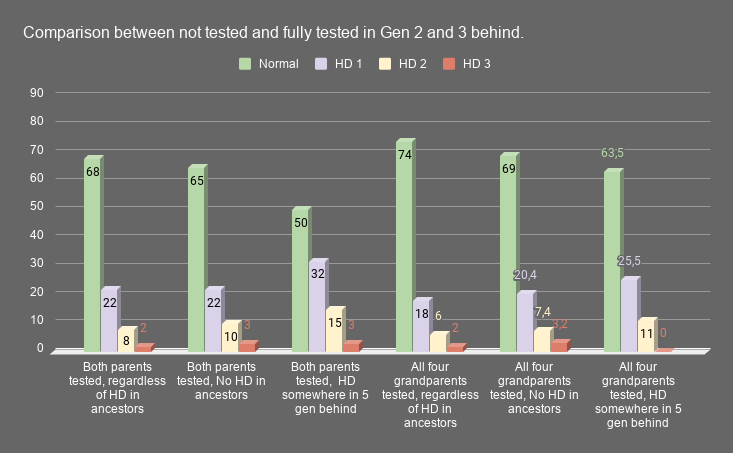
Finally, I had a look at the cats who had fully tested parents, (the first three bars), and those who had all of the 4 grandparents tested (the last three bars). There I comment on the different variants, first regardless of whether there were affected cats behind or not, second if there were no known affected cats behind and in third if there were affected cats in the next 5 generations behind.
By: Malin Sundqvist
")
")
")
")
")
")
")
")
")
")